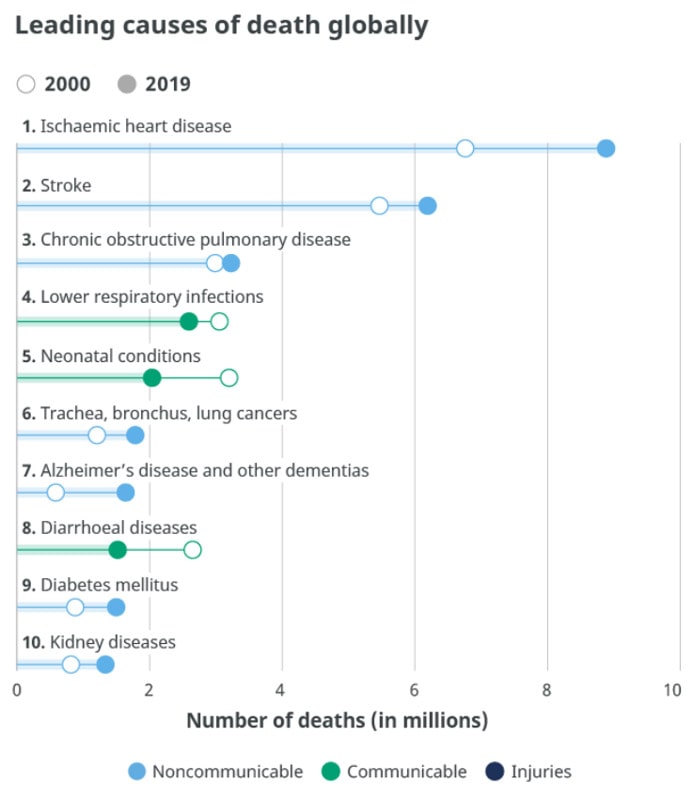
The most recent statistics analyzed by the World Health Organization were in 2019 (WHO, 2020). The top 10 causes of death accounted for 55% of the 55.4 million deaths worldwide, and non-communicable deaths; that is, those not passed from person-to-person, were responsible for the majority of deaths (see Figure \(\PageIndex{1}\). The three most common noncommunicable diseases were heart disease, stroke, and COPD. Tobacco use is attributed as one of the top killers and is often the hidden cause behind many of the diseases that result in death, such as heart disease and chronic lung diseases. Neonatal conditions, which include birth asphyxia and birth trauma, neonatal sepsis and infections, and preterm birth complications are the fifth highest cause.
Figure \(\PageIndex{1}\). Worldwide causes of death in 2000 and 2019. Image source.
These statistics hide the differences in the causes of death among high versus low income nations. In high-income countries, defined as havi)ng a per capita annual income of $12,696 or more, 70% of deaths are among people aged 70 and older. Only 1% of deaths occur in children under 15 years of age. People predominantly die of chronic diseases, such as cardiovascular disease, cancers, dementia, or diabetes. Lower respiratory infections remain the only leading infectious cause of death in such nations. In contrast, in low-income countries, defined as having a per capita annual income of $1045 or less, almost 40% of deaths are among children under age 15, and only 20% of deaths are among people aged 70 years and older. People predominantly die of infectious diseases such as lower respiratory infections, HIV/AIDS, diarrheal diseases, malaria and tuberculosis. These account for almost one third of all deaths in these countries. Complications of childbirth due to prematurity, birth asphyxia, and birth trauma are among the leading causes of death for newborns and infants in the poorest of nations (WHO, 2018; WHO, 2020).
The United States:
In 1900, the most common causes of death were infectious diseases, which brought death quickly. Today, the most common causes of death are chronic diseases in which a slow and steady decline in health ultimately results in death. However, COVID-19, an infectious disease, was the third most common reason for death in 2021 in addition to heart disease and cancer (see Figure \(\PageIndex{2}\), Ahmad et al., 2021).
Figure \(\PageIndex{2}\). Top ten causes of death in America in 2020. Image source.
COVID-19: Impact on Death and Dying
The World:
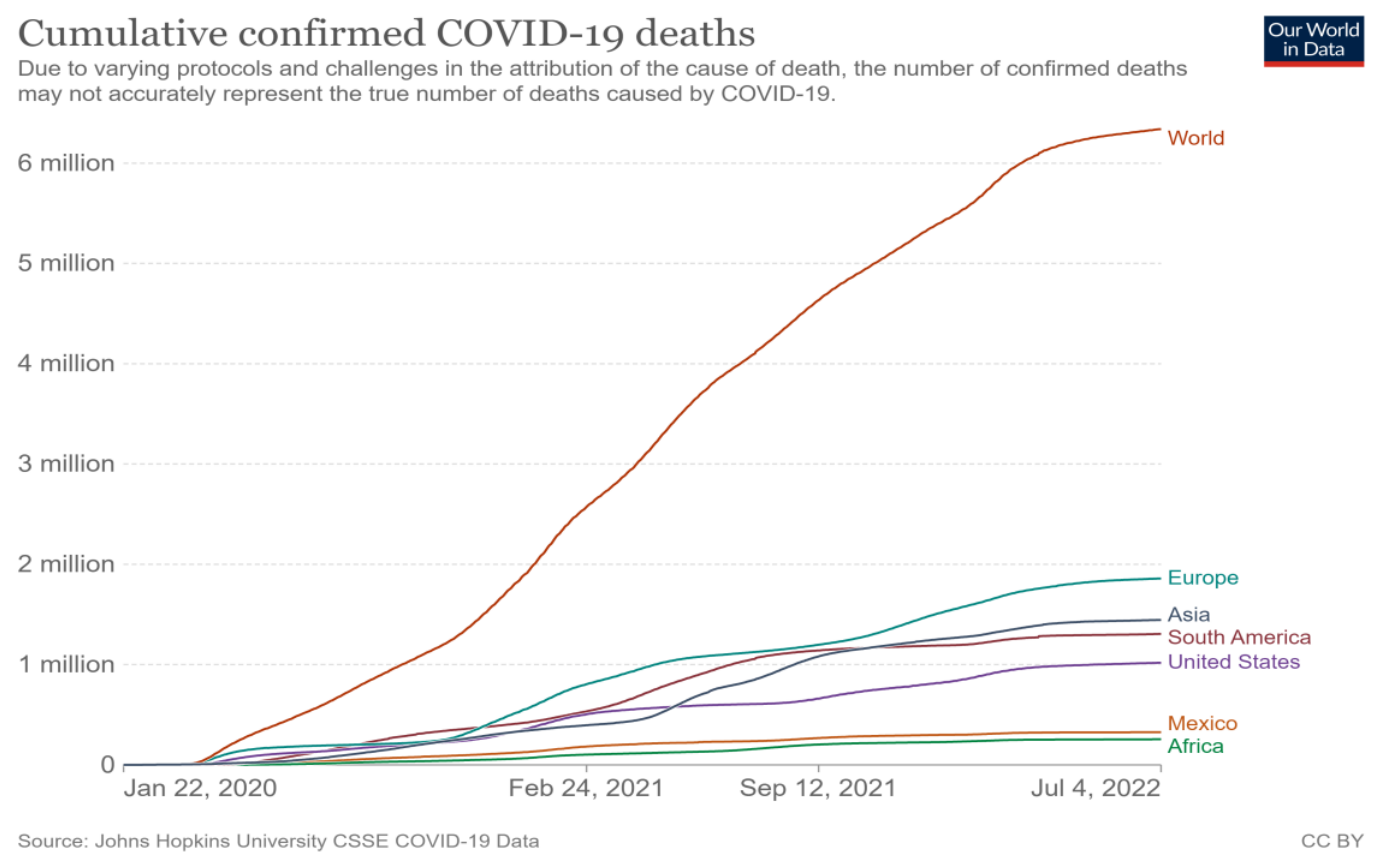
As of July 4, 2022, 6.34 million people in the world died from the COVID-19 virus (John Hopkins University, 2022). Figure \(\PageIndex{3}\) presents the number of deaths for the world, United States, and select regions from January 22, 2020 through July 4, 2022.
Figure \(\PageIndex{3}\). Worldwide COVID-19 deaths as of July 4, 2022.
Areas with high numbers of deaths include Europe (1.86 million), Asia (1.45 million), South America (1.31 million) and the United States (1.02 million), while fewer deaths were registered in Mexico (325,790 deaths) and Africa (255,120 deaths).
Worldwide Excess Mortality:
Estimates from the World Health Organization (2022) indicate that the full death toll associated directly or indirectly with the COVID-19 pandemic, described as excess mortality, between 1 January 2020 and 31 December 2021 was approximately 14.91 million (range 13.3 million to 16.6 million). Excess mortalityis calculated as the difference between the number of deaths that have occurred and the number that would be expected in the absence of the pandemic based on data from earlier years. Excess mortality includes deaths associated with COVID-19 directly (due to the disease) or indirectly, due to the pandemic's impact on health systems and society. For example, these include deaths attributable to other health conditions for which people were unable to access prevention and/or treatment because health systems were dealing primarily with the pandemic. The excess mortality represented 9.49 million more deaths than those globally reported as directly attributable to COVID-19. Twenty countries (including the United States), which represent approximately 50% of the global population, accounted for over 80% of the estimated global excess mortality during the 24-month period.
The United States:
As indicated above, as of July 4, 2022, the official COVID-19 deaths in the United States stood at 1.02 million. The U.S. officially reached one million deaths from COVID-19 on May 17, 2022. However, due to flaws in the data tracking and reporting systems, the number of fatalities on that date was likely much higher, according to the Johns Hopkins Center for Health Security (Donovan, 2022). Approximately 350,000 COVID-19 deaths occurred in 2020, 475,000 deaths in 2021, and 175,000 during the beginning of 2022. Of those who died, 75% were 65 and older, and more men than women died. Citizens who were Black, Hispanic, Pacific Islander and Native American suffered disproportionately compared to other groups. The nation's three largest states, that is, California, Texas, and Florida, recorded the most number of deaths. However, based on a per-capita basis, Mississippi, Arizona, and Oklahoma experienced the most deaths per 100,000 residents, while Hawaii and Vermont reported the lowest number per capita.
In 2020, the first deaths from COVID-19 occurred, and these additional 350,000 deaths resulted in approximately 3.4 million total American deaths, which was a record number (Stobbe, 2021). The high numbers of deaths in 2020 was also due to COVID-19 being a contributing cause of death for an estimated 377,883 deaths (Ahmad et al., 2021). In 2020, COVID-19 became the third leading cause of death behind heart disease and cancer (see Figure \(\PageIndex{4}\)).
Figure \(\PageIndex{4}\). The 3 leading causes of death in the U.S. in 2020. Image source.
As previously indicated, other causes of death also increased during 2020 (Stobbe, 2021). These included diabetes, Alzheimer's disease, Parkinson's disease, chronic liver disease, stroke, high blood pressure, kidney disease, influenza/pneumonia and unintentional injuries. Cancer rates declined in 2020, but researchers believe that those with cancer actually died due to COVID-19. Table \(\PageIndex{1}\) lists the main causes of death in 2020 and compares them to those of previous years.
Table \(\PageIndex{1}\). Number of Deaths for Leading Causes of Death, U.S., 2015–2020a.
No. of deaths by year
Causes of death
2015
2016
2017
2018
2019
2020
Total deaths
2,712,630
2,744,248
2,813,503
2,839,205
2,854,838
3,358,814
Heart disease
633,842
635,260
647,457
655,381
659,041
690,882
Cancer
595,930
598,038
599,108
599,274
599,601
598,932
COVID-19b
345,323
Unintentional injuries
146,571
161,374
169,936
167,127
173,040
192,176
Stroke
140,323
142,142
146,383
147,810
150,005
159,050
Chronic lower respiratory diseases
155,041
154,596
160,201
159,486
156,979
151,637
Alzheimer's disease
110,561
116,103
121,404
122,019
121,499
133,382
Diabetes
79,535
80,058
83,564
84,946
87,647
101,106
Influenza and pneumonia
57,062
51,537
55,672
59,120
49,783
53,495
Kidney disease
49,959
50,046
50,633
51,386
51,565
52,260
Suicide
44,193
44,965
47,173
48,344
47,511
44,834
aLeading causes are classified according to underlying cause and presented according to the number of deaths among US residents. For more information, see the article by Heron. Source: National Center for Health Statistics. National Vital Statistics System: mortality statistics (http://www.cdc.gov/nchs/deaths.htm). Data for 2015–2019 are final; data for 2020 are provisional.
Deaths with confirmed or presumed COVID-19, coded to International Statistical Classification of Diseases and Related Health Problems, Tenth Revision code U07.1 as the underlying cause of death.
Although the increased rate of deaths in 2020 was not all directly attributed to COVID-19, researchers believe that the excess mortality can be explained by ill patients not seeking treatment for their conditions because they feared becoming infected with the virus (Stobbe, 2021). As the hospitalization rates for COVID-19 increased, patients going to emergency rooms with symptoms of heart attacks and strokes decreased. Other factors associated with the virus and stay-at-home measures contributed to the higher death rates. These included patients not caring for themselves by not exercising, not taking prescribed medication, not managing stress, gaining weight, losing jobs, and losing health insurance. Overall, 25 states experienced more deaths than births in 2021, while historically the majority of states have more births than deaths.
Mortality Risk Based on Age:
According to a meta-analysis of representative samples from the U.S. and other nations, the COVID-19 virus poses a mortality risk for middle-age and elderly adults (Levin et al., 2020). The mortality risk for those infected with COVID-19 by age include:
0.002% at age
0.01% at age 25
0.4% at age 55
1.4% at age 65
4.6% at age 75
15% at age 85
exceeds 25% at ages 90+
Nursing Home Residents:
As can be seen in the above percentages, those in late adulthood suffer the greatest deaths from COVID-19, especially those older than 85 (CDC, 2021). Older adults are more likely to have underlying health conditions that make them more susceptible to illness, and they are more likely to reside in nursing homes that were especially vulnerable to the pandemic. As of April 2021, more than 131,000 nursing home residents in the United States died from COVID-19, making up nearly a quarter of all U.S. deaths from the pandemic (Chen et al., 2021). As of January 30, 2022, more than 201,000 long-term care facility residents and staff died since the beginning of the pandemic (Chidambaram, 2022). These elevated rates can be attributed to the highly transmissible nature of the Omicron variant, the large number of people intermingling in long-term care settings, and the high-risk status of those who reside in nursing homes.
Enforcement of pandemic protocols in the long-term care industry was deemed too lax by many watchdog groups, even though federal regulators issued fines to 3,400 nursing home for COVID-19 violations. Fines were given for the incorrect use of mask, gowns and other personal protective equipment, lack of following quarantine or isolation protocols, not enforcing social distancing, and not separating those residents testing positive for the virus. The increased susceptibility for older adults and the above violations contributed to the higher death rates for those in nursing homes (Chen et al., 2021).
Pre-COVID Deaths:
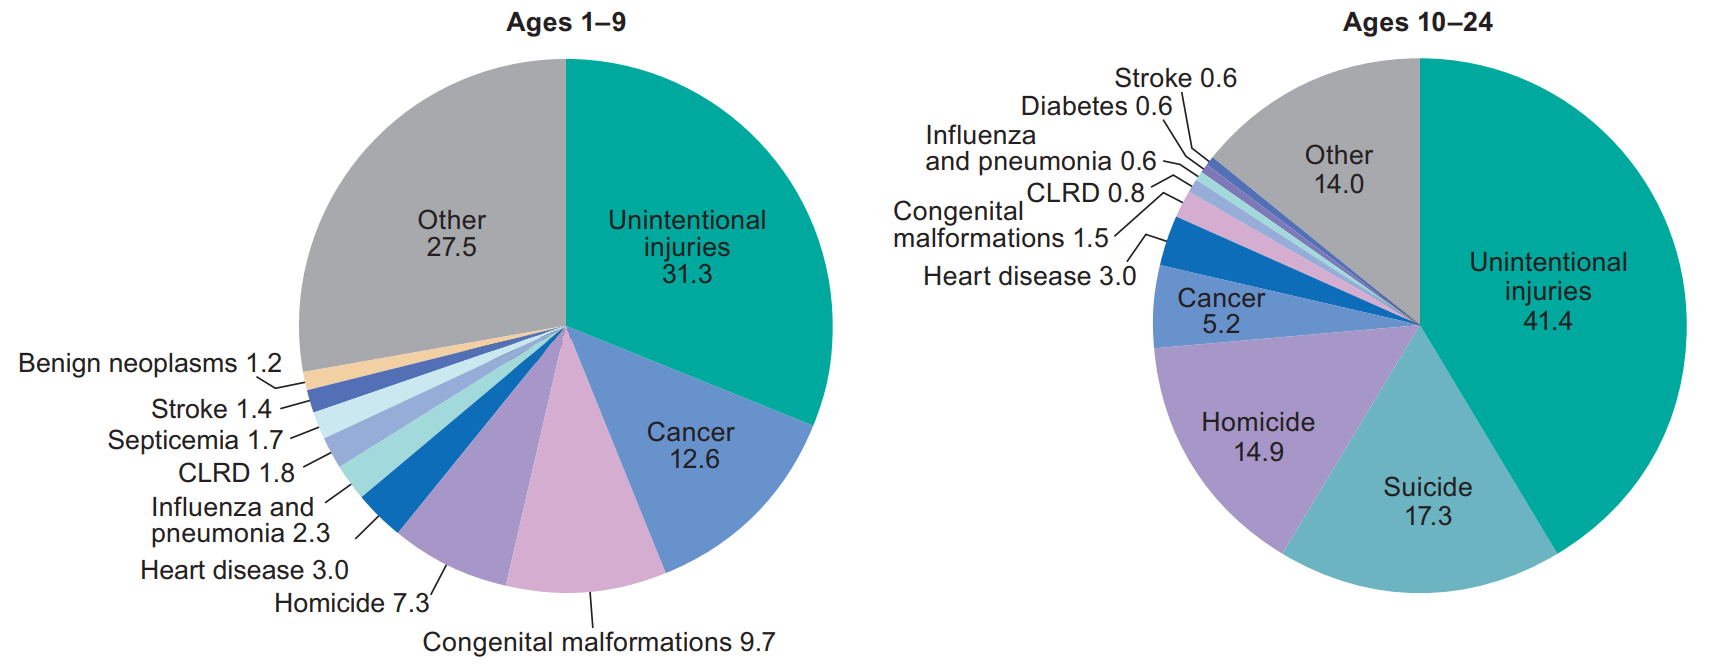
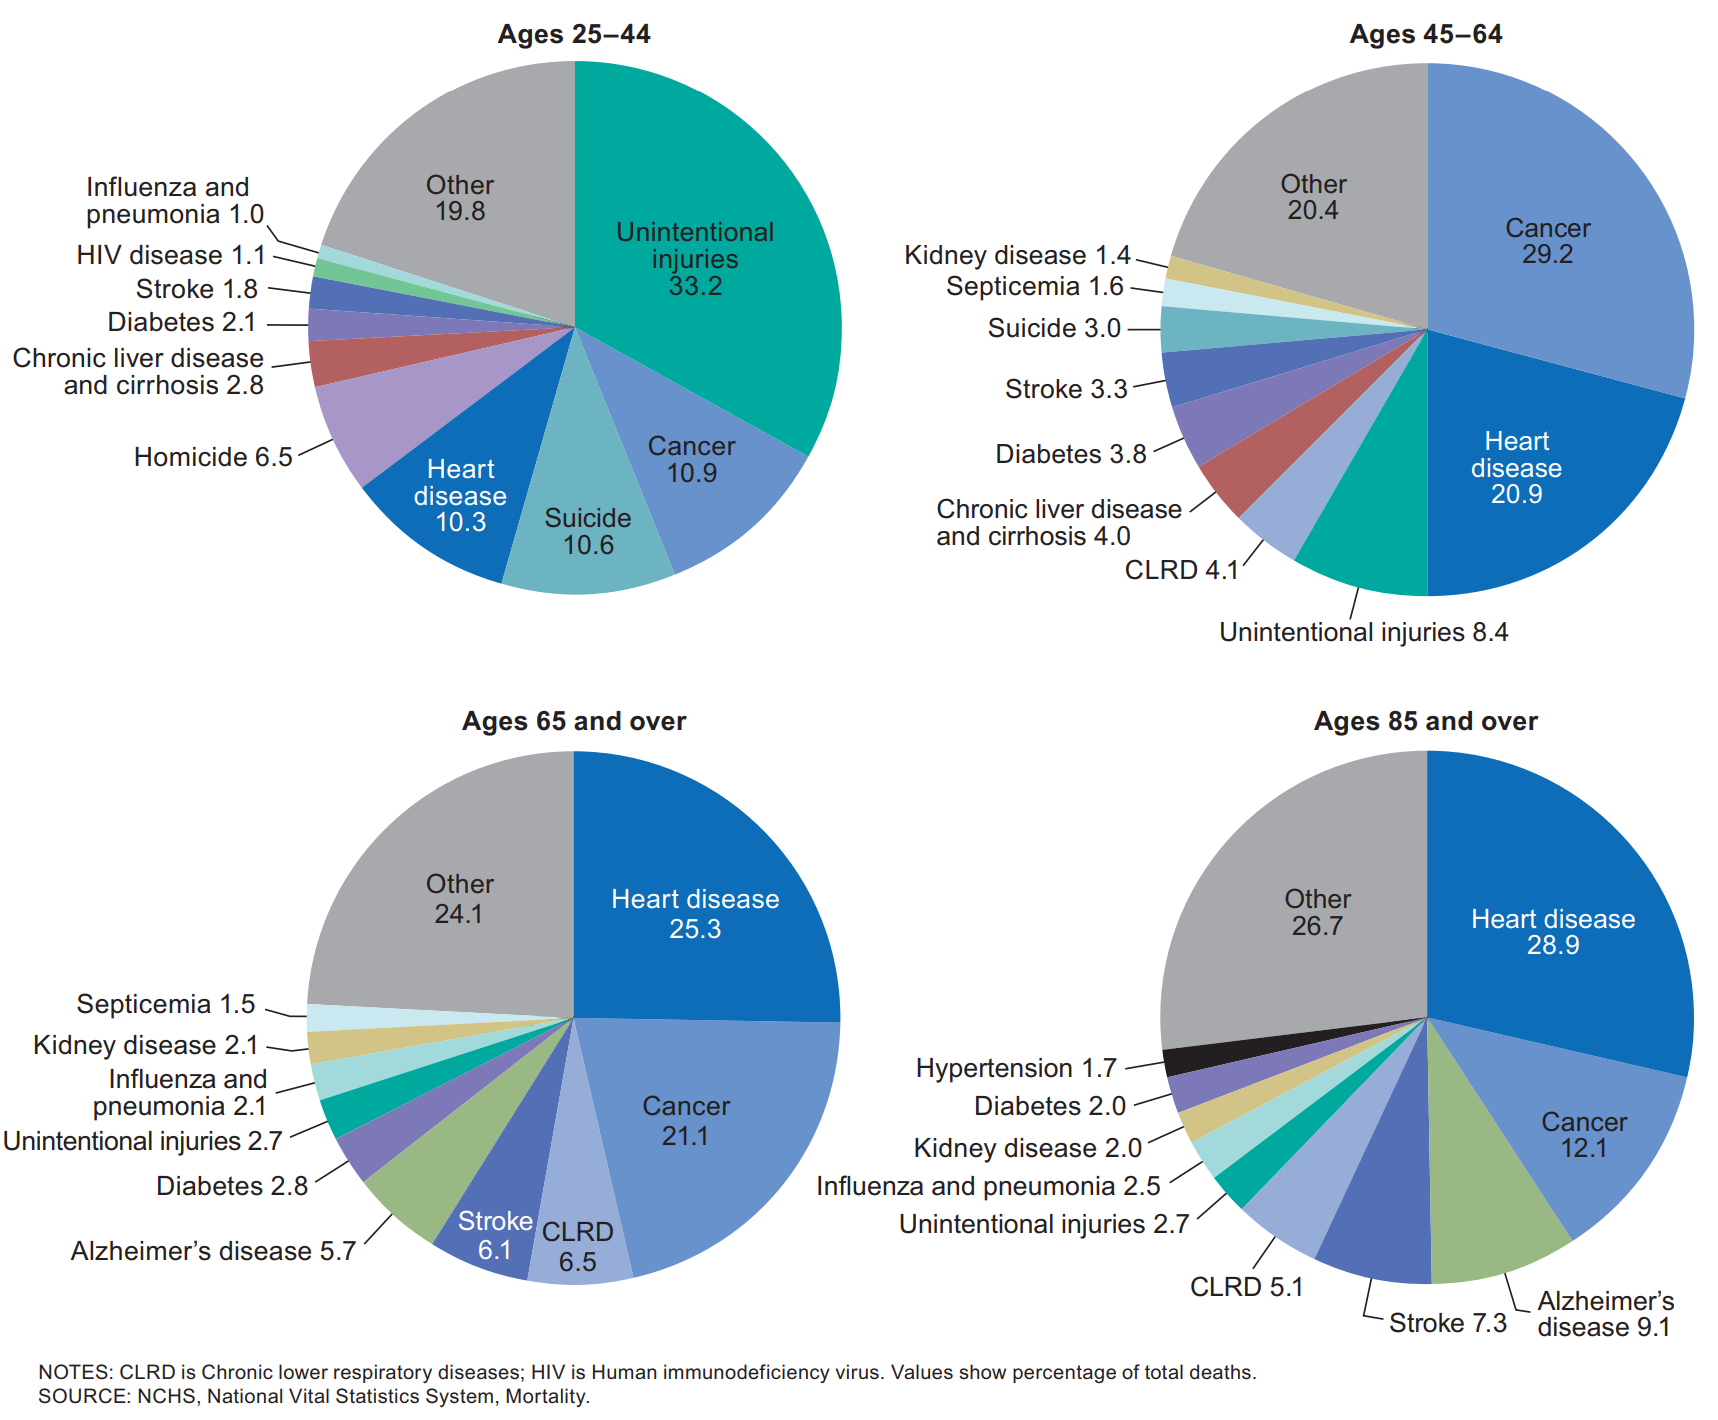
Before COVID-19, the causes of death varied by age (see Figure \(\PageIndex{5}\) and \(\PageIndex{6}\), Heron, 2018). Prior to age 1, SIDS, congenital problems, and other birth complications are the largest contributors to infant mortality. Accidents, known as unintentional injury, become the leading cause of death throughout childhood and into middle adulthood. In later middle adulthood and late adulthood heart disease, cancer and other medical conditions become the leading killers.
Figure \(\PageIndex{5}\). Major causes of death in the U.S. in 2016, ages 1 to 24. Image source (p. 11).Figure \(\PageIndex{6}\). Major causes of death in the U.S. in 2016, ages 25 to 85+. Image source (p. 11).
Chapters 8 and 9 discussed the chronic conditions that are associated with dying at later stages in life. However, suicides and drug overdoses are currently claiming lives throughout the lifespan, and consequently will be discussed next.
Suicide
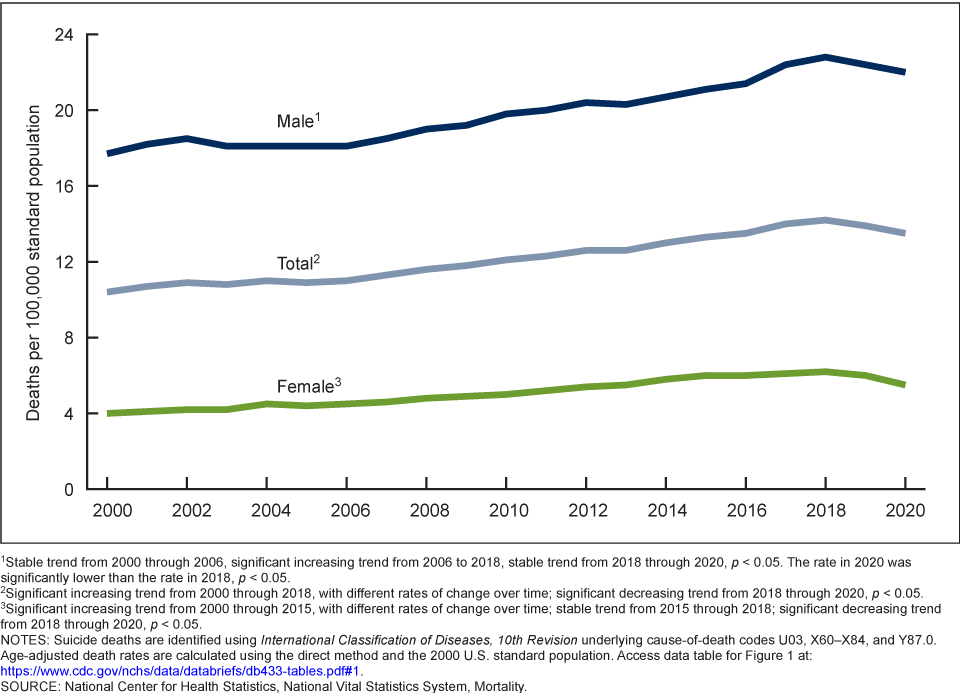
According to the latest research from the CDC (Garnett et al., 2022), the suicide rate increased 30% between 2000 and 2020. However, there was a 5% decline from the peak of 14.2 per 100,000 in 2018 to 13.5 per 100,000 in 2020. In the United States, suicide is the 12th leading cause of death overall, but it ranks as the 2nd leading cause of death for those aged 10–34 and the 5th leading cause for those aged 35–54. In total, 45,855 people died by suicide in 2020, which was 3% lower than 2019 when 47,511 people died by suicide (Curtin & Hedegaard, 2021). Suicide rates for females in all race and Hispanic-origin groups declined between 2019 and 2020, while rates declined for non-Hispanic white and non-Hispanic Asian males, but increased for non-Hispanic black, non-Hispanic American Indian or Alaska Native, and Hispanic males. Males have consistently demonstrated higher rates of suicide as they typically experience higher rates of substance use disorders, do not seek out mental health treatment, and use more lethal means. However, females also respond to the stress in their lives through self-harm, substance abuse, and risk taking behaviors (Healy, 2019).
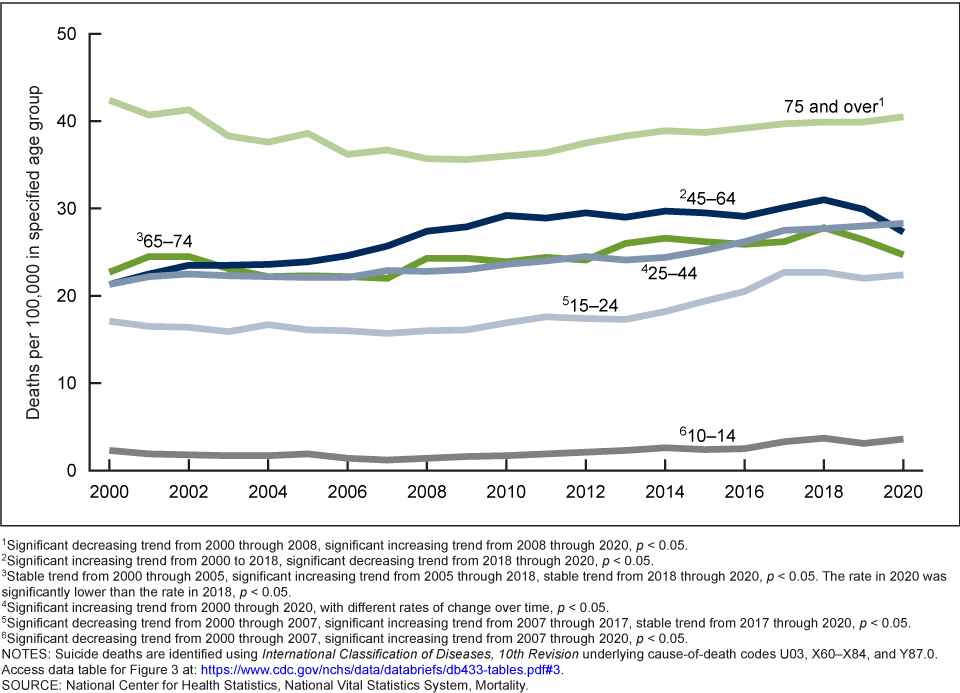
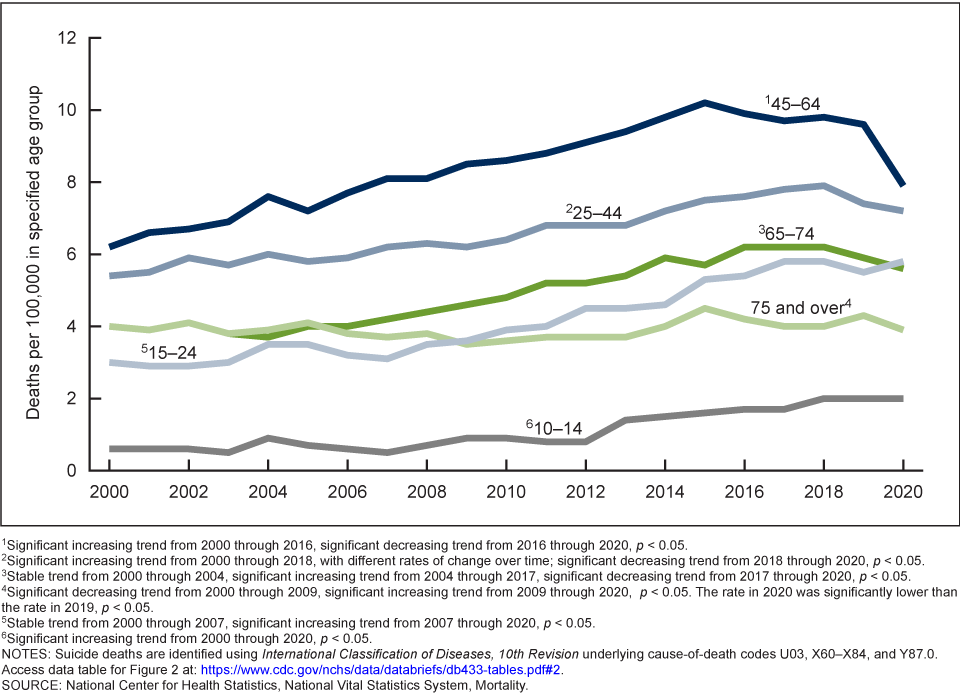
For males, the rate increased from 17.7 per 100,000 males in 2000 to 22.8 per 100,000 in 2018, but then declined to 22.0 per 100,000 in 2020. For females, the rate increased from 4.0 per 100,000 females in 2000 to 6.2 per 100,000 in 2018, but then dropped to 5.5 per 100,000 in 2020 (see Figure \(\PageIndex{7}\)). By ages, suicide rates for males aged 75 and older were the highest. From 2018 to 2020, suicide rates decreased in males aged 45–74, while rates increased for males aged 15–44. Female suicide rates declined for all groups over age 25, but increased for those aged 10–24. The highest female suicide rates were for those aged 45–64 (Garnett et al., 2022) (see Figures \(\PageIndex{8}\) and \(\PageIndex{9}\)).
Figure \(\PageIndex{8}\). Male suicide rate by age group, U.S., 2000–2020. Image source.Figure \(\PageIndex{9}\). Female suicide rate by age group, U.S., 2000–2020. Image source.
Deaths of Despair:
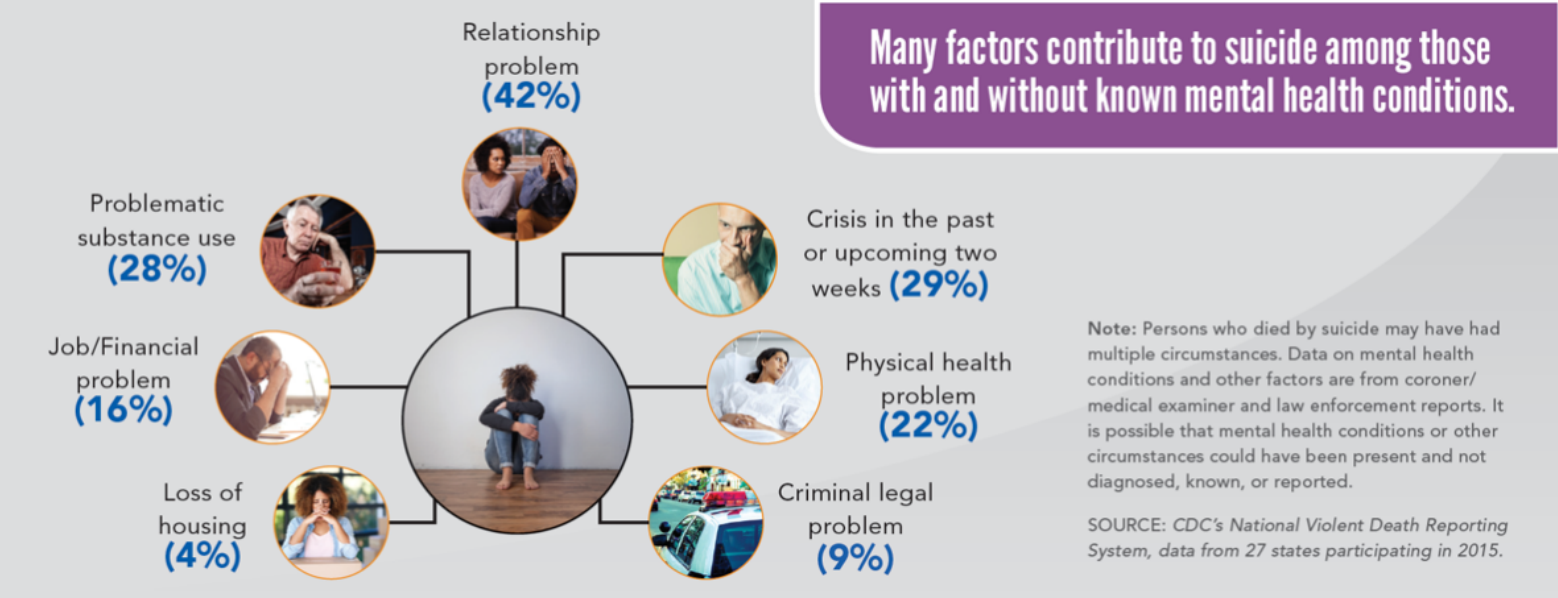
Globally, suicide rates have fallen when the living conditions have improved (Weir, 2019). Not surprisingly, the opposite trend occurs under the opposite condition, and thus a decrease in economic and social well-being, referred to as deaths of despair, have been linked to suicides in America. The loss of farming and manufacturing jobs are believed to have contributed to deaths of despair, especially in rural communities where there is less access to mental health treatment. According to the CDC (2018), other factors that contributed to suicide among those with, and without, mental health conditions included relationship problems, substance use disorders, financial or legal problems, and health concerns (see Figure \(\PageIndex{10}\)).
Figure \(\PageIndex{10}\). Various reasons given for suicide. Image source.
Prevention:
Globally, limiting access to lethal means has contributed to a decrease in suicide rates (Weir, 2019). For example, switching from less-toxic gas for heating decreased carbon monoxide deaths, making it more difficult to access toxic pesticides decreased poisoning deaths, installing bridge barriers decreased jumping, and limiting access to firearms lowered deaths by guns. Equally important are prevention programs and improving access to mental health treatment, especially in the workplace. Many occupations have seen increases in suicide rates, and consequently specific programs are being designed to address the stressors associated with these jobs. Knowing the warning signs of suicide and encouraging someone to get treatment are things that everyone can do to address the increase in the suicide rate.
CDC's 12 Warning Signs of Suicide
Feeling like a burden
Being isolated
Increased anxiety
Feeling trapped or in unbearable pain
Increased substance use
Looking for a way to access lethal means
Increased anger or rage
Extreme mood swings
Expressing hopelessness
Sleeping too little or too much
Talking or posting about wanting to die
Making plans for suicide
Fatal Drug Overdoses
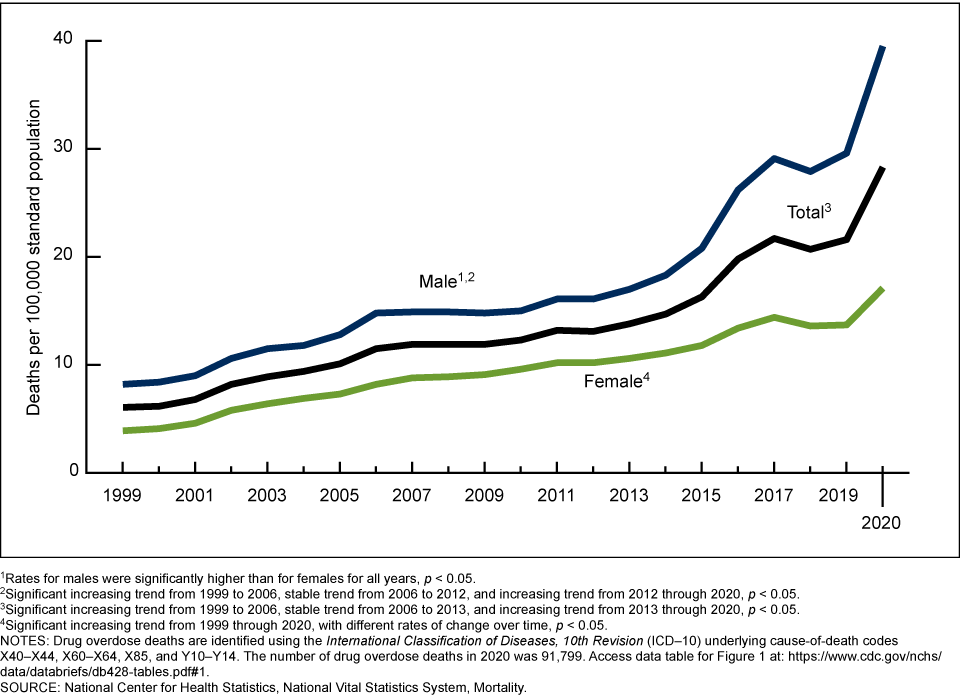
Figure \(\PageIndex{11}\). Age-adjusted drug overdose death rates, U.S., 1999–2020. Image source.
Another factor linked to the deaths of despair has been fatal drug overdoses. In 2020, 91,799 drug overdose deaths occurred in the United States for a rate of 28.3 people per 100,000 (Hedegaard et al., 2021). The rate in 2020 was 31% higher than the rate in 2019 (21.6 people per 100,000), and the rate of drug overdose deaths increased for all race and Hispanic-origin groups. Additionally, the rate for males increased from 29.6 to 39.5 and the rate for females increased from 13.7 to 17.1. For each year from 1999 through 2020, the rate for males was higher than for females (see Figure \(\PageIndex{11}\)). Unlike suicide rates, deaths from overdoses occur equally among those living in urban and rural areas.
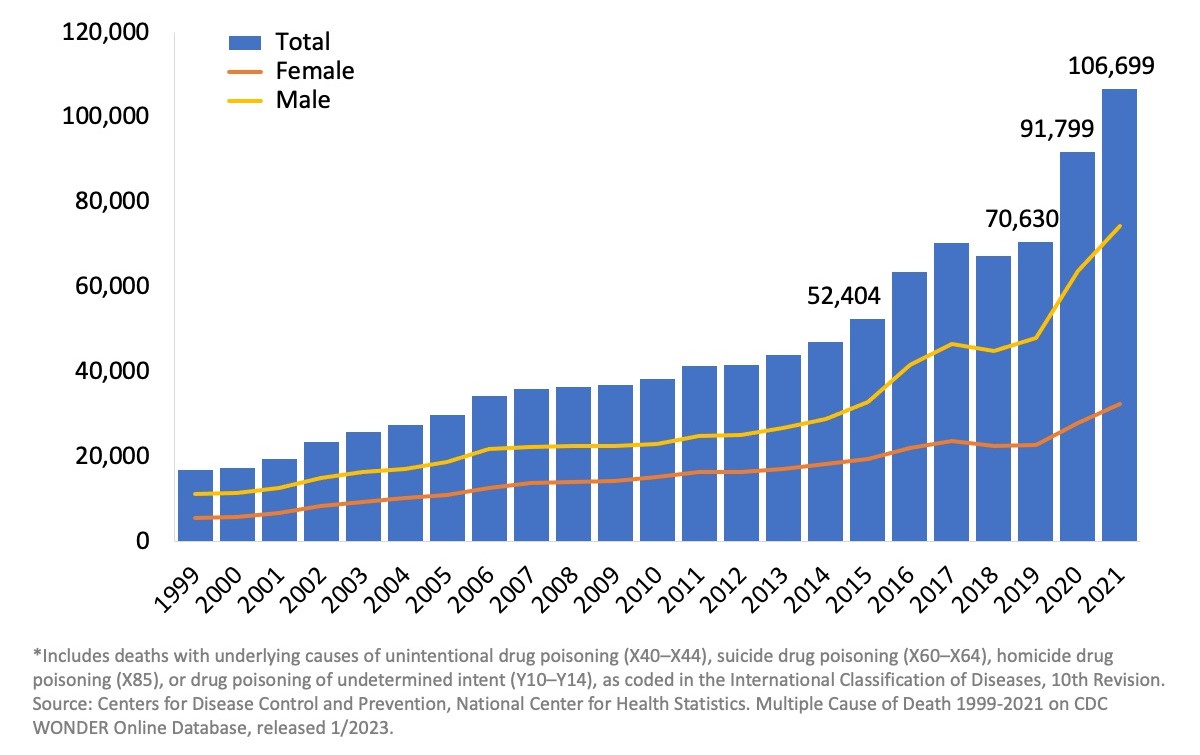
The rate of drug overdose deaths involving synthetic opioids other than methadone (drugs such as fentanyl, fentanyl analogs, and tramadol) increased 56%, from 11.4 in 2019 to 17.8 in 2020 (NIH, 2022). Fetanyl is an especially powerful opioid that can easily lead to a fatal overdose. Because it is synthetic, it is cheap to make and easier to conceal than heroin. As can be seen in Figure \(\PageIndex{12}\), deaths from opioids have increased significantly since 1999.
Figure \(\PageIndex{12}\). U.S. overdose deaths involving any opioid from 1999 to 2021. Image source.